Interesting Weather Information

Tuesday, July 12, 2022

Outflow Boundaries and The 6 June 2022 Goshen, Ohio Tornado


The Tornadoes of 6 July 2022 near Cincinnati, OH, USA

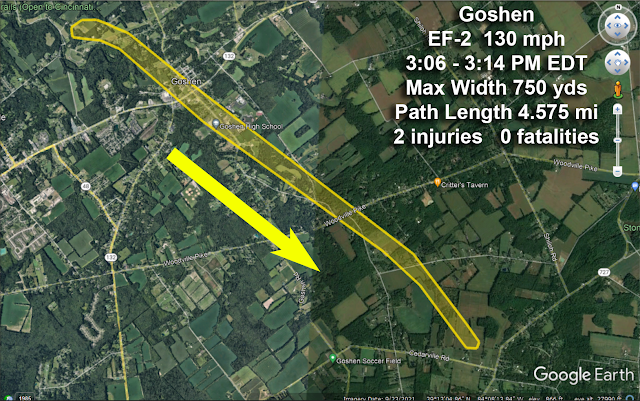
Around 3PM EDT 6 July 2022 three tornadoes touched down east of Cincinnati, two in Clermont County and one just east in Brown County. The maps below show the locations.  


What Meteorologists Look for When Tracking Tornadoes on Radar

The video below, with an audio narration, shows the movement of the severe thunderstorms and outflow boundaries resulting in the three tornadoes. Tools I used: RadarScope, a professional level radar analysis tool, GR2 Analyst for the Normalized Rotation (NROT) data, Google Earth Pro, Photoshop and Camtasia Studio.

In the video I show the interaction of an Outflow Boundary (OFB) and the severe thunderstorm as it approaches.  You will see how there is a sudden increase of strength as the storm interacts with the outflow boundary.


Conclusions:  
  • The storm interacted with the outflow boundary and strengthened it just east of Goshen.
  • The OFB did not "cause" the tornado, because the storm was rotating before it interacted with the OFB.
  • The storm did not ride up and over the OFB the the rain cooled pool of air behind it as many storms do (videos below).
  • Most likely the OFB acted to increase surface convergence ahead of the updraft core, strengthening the updraft enough to increase the rotation through vertical stretching see video below). 
Stretching an Updraft and Increasing Rotation


A Typical Thunderstorm - No Audio


The next video, from my YouTube library, shows a schematic of a typical thunderstorm.  

To be sure, "typical" does not mean all thunderstorms look exactly alike. You can pause the video and look at the diagram in more detail if you want to get a better feel for what's going on in and around a thunderstorm.

You can pause the video for a closer look. Be sure to look at the "Forward Flank Downdraft" or "Gust Front" another name for an "Outflow Boundary" (OFB).


The video below (this one has audio) shows how the pool of rain cooled air can increase lift, or upward motion, in a thunderstorm. In the Goshen tornado this may have played a part as the inflowing air wrapped around the rotation core and flowed into and upward through the storm.

It is more likely in this case that an "low level inflow jet" flowed parallel to the OFB and was "squeezed" (another way of saying surface convergence was increased) as it flowed into the storm and intensified the updraft.

I do not have enough radar evidence to be conclusive about this however.


Other Video Examples of  Outflow Boundaries and Their Effects for You

 All videos are silent.


Thursday, February 17, 2022

"Rogue" Thunderstorm 02.17.2022 Near Cincinnati, Ohio

We were watching the thunderstorm grow then scream to the northeast over Madison, IN and were amazed at the torrential rain, indications of hail on radar, and worried that it may mean a severe thunderstorm warning for Cincinnati metro. GR2Analyst indicated an extreme tilt, and Normalized Rotation (NROT) was zero. 

In addition there was a small core of  turbulence (spectrum width) which looked like a hail core. Echo tops were low, only about 20k feet and only a small amount of lightning was indicated. 

In addition the cell's position just northeast of the surface low convinced me that the storm, which was behind the surface position of the cold front, formed on the frontal surface aloft and being elevated convection was not likely to pose a damaging wind threat.

The NWS in Wilmington tweeted that it was a "rogue storm" which fits because it is the only lightning producer in the Cincinnati area all day despite our expectations of more.


@NWSILN Tweet

Rogue Storm passes over Madison, IN heading to Cincinnati

Close up of Rogue Storm


HRRR MODEL OUTPUT -  850mb Jet east of arrows - animated gif

ABOVE:
HRRR 18z Run 02.17.2022 (from pivotalweather.com)
First panel 18z Initial
55kt - 65kt 850mb jet over West Central KY
Temp at 850mb 9°C to 10°C
Temp Advection 5°C / hr on the nose of jet
Circle = 850 frontogenesis - circle is 2°C / 100km / 3hrs

Second Panel 21z Forecast
50kt to 80kt 850 jet  - nose south of Cincinnati
Temp 9°C to 10°C Madison IN
Temp Advection 3°C to 4°C same area nose of jet
Circles = Frontogenesis has doubled around Cincinnati


SURFACE MAP 21Z 02.17.2022 using Digital Atmosphere


Tuesday, August 11, 2020

Blitzkrieg Weather: The Derecho

 It may seem odd that the title this post contains two words from languages other than English. The German word blitzkrieg meaning "lightning war" and the Spanish derecho meaning "straight ahead" (pronounced day-RAY-cho). So first some history.

HISTORICAL BACKGROUND

In 1863 Dr. Gustavus Detlef Hinrichs joined the faculty of the University of Iowa and taught physical science. In 1875 he organized the Iowa Weather Service, the first state weather service in the United States. In 1877 he published Volume 1 No. 1 of the Iowa Weather Bulletin.


In 1888 Dr. Hinrichs coined the term "derecho" to describe a line of severe wind storms that crossed Iowa on July 31, 1877. Below is his map from that publication showing how the derecho crossed the entire state causing damage all the way.


As Dr. Hinrichs discovered in his research, a derecho is a strong line of thunderstorms. He used the Spanish word for  "straight ahead"  to describe the main cause of damage - straight line winds.  As the story goes he wanted to be consistent with the term tornado which is also rooted in the Spanish language.

Tornado is from the Spanish verb "tornar" meaning to turn. Because both words, derecho and tornado, are derived from Spanish the plural forms of both derecho and tornado do not use the letter "e" before the "s". So the plural is derechos NOT derechoes and tornados NOT tornadoes. However "tornadoes" is more commonly used.

The name derecho was soon forgotten but finally resurrected in 1987 by National Severe Storms Forecast Center meteorologists Robert Johns and William Hirt in their paper, "Derechos: Convectively Induced Windstorms" (Weather and Forecasting, Vol.2 page 32).

That other foreign word in the title, the  German term "Blitzkrieg", means "lightning war". During WWII it was a way of doing battle by striking fast and forcefully and quickly breaking through the defenses of the enemy.  It is also very descriptive of how a derecho causes damage.

WHAT IS A DERECHO

A derecho is a long, line of thunderstorms (to the meteorologist a linear mesoscale convective system or linear MCS) that can live 12 hours or more, travel hundreds of miles and all the while generate straight-line winds in excess of 100 mph. While straight-line winds are its main feature tornadoes can be spawned and flooding rains and large hail can occur.
 
The image below is a radar history of the costly derecho of June 29-30, 2012 that visited the FOX19 NOW viewing area. It was the deadliest and most destructive derecho in American history. As many as 28 people lost their lives and 4 million lost power (1 million in Ohio). The highest wind gust was 91 mph in Fort Wayne, IN and hail as large as 2.75" in diameter fell in Bismarck, IL. It traveled 600 miles and lasted 18 hours.


MORE THAN ONE TYPE OF DERECHO

Serial Derecho - Most of the time a serial derecho is composed of a series of linked bow echoes in the warm sector and straddling the warm or stationary front.


Progressive Derecho - The classic progressive derecho consists of a single big bow echo, but it can be multiple bow echoes, straddling a warm or stationary front and pushed to the east or southeast by strong winds in the lower and middle atmosphere.


Hybrid Derecho - It has characteristic of both progressive and serial derechos.

Low Dew Point Derecho - Mainly a late fall to early spring phenomenon when the humidity of summer has withdrawn into the deep south.  This is essentially a series of dry  thunderstorm downbursts and has not received much study.


PROGRESSIVE DERECHO OF AUGUST 10, 2020


Derecho Aug 10, 2020
Derecho of August 10, 2020
Animation generated at http://weather.rap.ucar.edu/radar/ 
then screen captured with Camtasia and rendered as a gif

Sunday, May 3, 2020

Ohio, Kentucky, Indiana Tornadoes 1950 through 2018

I am currently working on collecting and manually entering preliminary latitude and longitude coordinates along with other information from NWS Forecast Office tornado surveys to update the map through 2019 and into 2020.

The data here are from the official NOAA SPC database updated and quality controlled in September 2019 through the year 2018.

It may take some time to load the 23 columns of data for 3559 tornadoes that touched down in Ohio, Kentucky and Indiana from 01.01.1950 through 12.31.2018. Your system may also run a bit slow but I have tested both mobile and desktop versions and have found no other problems.

Made to Zoom and Search.
F/EF Scale Color Coded
Click on a pin for Tornado Info
Zoom way in for greatest visual accuracy
Click the links below to access the interactive map


For DESKTOP: 

CLICK HERE: OH, KY, IN Tornadoes 1950-2018 Interactive Map

For MOBILE:  

1. Install Google Earth first (it is Free)

2. Use the link below for the OK KY IN tornado .kmz file 

3. Download the OKI TORNADOES.kmz and open

iPhone and Android


Tap the 3-Dot Gadget
Scroll down to "Open In" and Tap

Android - Google Earth Opens

iPhone Swipe R to L to "More" and Tap
Scroll Down to "Copy to Google Earth"


Wednesday, April 15, 2020

19 Weak Tornadoes: April 8-9, 2020 Near Cincinnati, Ohio


Click on any image for a larger version
Current Through 12:20 am 04.17.2020


Touchdown locations of the 19 Tornadoes on April 8-9, 2020

Track Map #1 Versailles, IN, Ripley Co.
Link to NWS ILN Statement
Track Map #2 north of Friendship, IN, Ripley Co.
Link to NWS ILN Statement
Track Map #3 starts south of Dillsboro, IN in southern 
Dearborn Co. ends in rural Ohio County, IN
Link to NWS ILN Statement
Track Map #4 starts  in rural Ohio County, IN and 
ends just south of Rising Sun, IN
Link to NWS ILN Statement
Track Map #5 Just east of Warsaw, KY in Gallatin Co, KY
Link to NWS ILN Statement


Track Map #6 Northwest of Dry Ridge, KY in Grant Co.
Link to NWS ILN Statement
Track Map #7 Across southern Pendleton 
County, KY south of Falmouth
Link to NWS ILN Statement

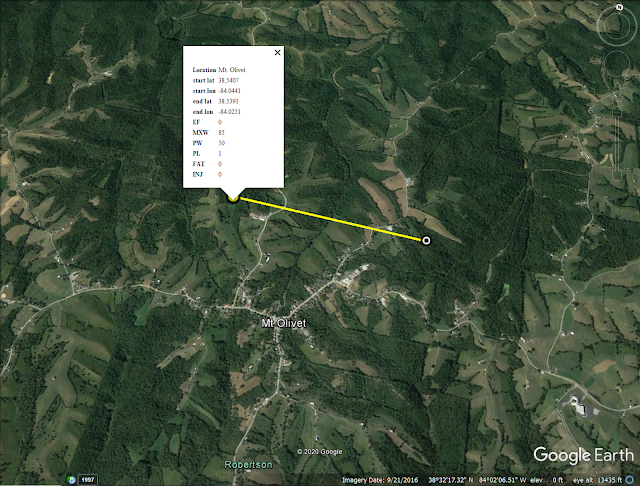
Track Map #8 North of Mt. Olivet, Robertson County, KY
Link to NWS ILN Statement

Track Map #9 Near Mays Lick, soutern Mason County, KY
Link to NWS ILN Statement


Track Map #10 Near Edenton, OH, 
northern Clermont County, OH
Link to NWS ILN Statement
Track Map #11 From southeast of Blanchester in southern 
Clinton County Ohio into rural northern Brown County, Ohio.
Link to NWS ILN Statement

Track Map #12 Newtonsville, OH in northern Clermont 
County to Lake Lorelei, northern Brown County Ohio
Link to NWS ILN Statement


Track Map #13 From south of Lake Lorelei to 
south of Fayetteville, Ohio in Brown County.
Link to NWS ILN Statement

Track Map #14 From near Kenwood across 
Indian Hill in Hamilton County, Ohio.
Link to NWS ILN Statement


Track Map #15 From near Northgate Mall across 
Springfield Township and Mt. Healthy past 
Finneytown into Wyoming, Hamilton County, Ohio.

Track Map #16 Far southwestern Ohio County, IN.


Track Map #17 Cross Plains, Ripley County, IN.

Track Map #18 Between Farmers Retreat and Dillsboro, 
Dearborn County, IN

Track Map #19 North of Bracht, KY Kenton County, KY


Thursday, May 30, 2019

Radar Views of the Brookville to Trotwood to Dayton to Riverside EF4 Tornado May 27, 2019

I will annotate and caption the images as I get time. For now here are the frames.

Using GR2Analyst here are PPI and 3D images from the tornado just east of Trotwood, OH at 0257z  28 May 2019 (10:57 PM EDT 27 May 2019).