The long-track, steady state Supercell Thunderstorm is the definitive top dog in thunderstorm development. It is the 500 pound gorilla of the cumulonimbus world.
All thunderstorms are cumulonimbus clouds and whether they work alone (or discreetly) like ordinary summer afternoon cells and most supercells or together like the various forms of squall lines by definition they all have lightning and thunder and the cloud type is cumulonimbus.
A lone, single-cell thunderstorm, born of daytime heating on a humid summer afternoon may live 45 minutes and travel 10 miles. The long-track, steady state supercell can live 12 hours, travel 500 miles and all along the way wreak havoc and deadly destruction with large hail, flooding rains, gusty winds and the ultimate prize of the storm chasers quest - the tornado.
So what is the secret to living a long, destructive lifetime?
Part of the answer is the "steady state" nature of the supercell. That means the storm imports energy from the environment at about the same rate that it uses it. As long as the balance persists the thunderstorm continues on its marathon journey across the landscape.
But there is more to this story. You might wonder why a simple, solo, summer afternoon thunderstorm lives only 45 minutes while the supercell can persist for hours.
That some thunderstorms persisted for much longer than others was first brought to the world's attention in 1949 by Horace Byers and Roscoe Braham, Jr. They attributed the long life to wind shear in the environment that tilted the updraft causing rain to fall outside the updraft not down through the rising air.
This is were interaction between the supercell and its environment becomes important. Interactions between storms and the storm environment happen in many ways, but three types of interaction are particularly important.
For long-track, steady state supercells the environment provides high octane fuel in the form of warm moist air. The water vapor is imported into the updraft and lifted then condenses releasing heat that helps energize the storm.
The environment also supplies rotation that is pulled into the storm. If conditions are right a mesocyclone can "spin up" within the supercell giving birth to a tornado. I will cover this later in this post.
But it is the interaction of vertical wind speed shear in the environment with the storm that sets the stage for a cross country trek of several hundred miles.
In a simple, single-cell thunderstorm (recall they are still called "air mass" thunderstorms but this is old and inaccurate terminology and are more accurately called single-cell or solo or ordinary thunderstorms) that forms in a low shear environment, like the one on the left in the image, the updraft is nearly vertical and the rain that condenses falls "down the chimney". The updraft has to work against the falling rain and this limits how long the single-cell thunderstorm can live.
In an environment with vertical wind speed shear, right side of the diagram, the updraft tilts and the rain does not fall down through the updraft. The result is a storm with a longer lifetime.
If the shear is too great the storm will not form because the plume that becomes the updraft is sheared apart. This is also an issue meteorologists face when forecasting hurricanes.
The supercell draws in warm, moist air from hundreds of square miles around it. The energy that originally evaporated the water vapor is released back to the storm when it condenses and this conversion helps drive the storm for hours. When the warm, moist inflow is cut off from the the storm it decays.
Tilted updrafts, Echo Free Vaults and More
By the early 1960s tilted updrafts were recognized as an integral part of many thunderstorms, including what was called the SR-Thunderstorm (Severe Right moving - of the average wind) by British Meteorologist Keith Browning. In 1964 he coined the term "supercell" for storms that had the characteristics that we know today as those long-track, long-lived thunderstorms that may produce big tornadoes. We will get back to Browning in a bit.
A Brief Digression: Why right moving of the average wind?
Both dynamic mechanisms and the distribution of rainfall along with the growth and/or decay of the cold pool work together to dictate the fate of a supercell.
Put simply all the factors mentioned and likely others work to lower the pressure in the updraft on the right side of the storm and raise the pressure on the left side of the storm (rear flank downdraft and forward flank downdraft) causing the storm to move to the right of the mean wind. Rising air means lower pressure, sinking air means higher pressure.
Because the storm is steady-state (using energy at the same rate it imports it) and because the updraft is tilted and the rain falls outside the updraft the typical supercell travels in a nearly straight line to the right of the mean wind and can do this for hours until the steady-state balance is upset.
Now Back to Browning and the early 1960s.
Browning stopped his radar from rotating and scanned vertically getting the Range-Height Indicator (RHI) views below. Range means distance from the radar and height is self-explanatory. These radar reflectivity profiles were the start of our modern understanding of supercells.
The radar images above are from Browning's research and by today's standards very primitive, but then a technological marvel. He was able to see the heavy downpour of the supercell. The front edge of it was called the "wall". The echo free vault , now called the WER (weak echo region) or the BWER (bounded weak echo region) identifies the warm moist inflow and updraft.
You may ask why the updraft looks vertical and not tilted. Remember this is a 2D slice of the storm and the tile occurs in 3D so it is not likely that a given slice will see the tilt/


All thunderstorms are cumulonimbus clouds and whether they work alone (or discreetly) like ordinary summer afternoon cells and most supercells or together like the various forms of squall lines by definition they all have lightning and thunder and the cloud type is cumulonimbus.
A lone, single-cell thunderstorm, born of daytime heating on a humid summer afternoon may live 45 minutes and travel 10 miles. The long-track, steady state supercell can live 12 hours, travel 500 miles and all along the way wreak havoc and deadly destruction with large hail, flooding rains, gusty winds and the ultimate prize of the storm chasers quest - the tornado.
So what is the secret to living a long, destructive lifetime?
Part of the answer is the "steady state" nature of the supercell. That means the storm imports energy from the environment at about the same rate that it uses it. As long as the balance persists the thunderstorm continues on its marathon journey across the landscape.
But there is more to this story. You might wonder why a simple, solo, summer afternoon thunderstorm lives only 45 minutes while the supercell can persist for hours.
That some thunderstorms persisted for much longer than others was first brought to the world's attention in 1949 by Horace Byers and Roscoe Braham, Jr. They attributed the long life to wind shear in the environment that tilted the updraft causing rain to fall outside the updraft not down through the rising air.
This is were interaction between the supercell and its environment becomes important. Interactions between storms and the storm environment happen in many ways, but three types of interaction are particularly important.
For long-track, steady state supercells the environment provides high octane fuel in the form of warm moist air. The water vapor is imported into the updraft and lifted then condenses releasing heat that helps energize the storm.
The environment also supplies rotation that is pulled into the storm. If conditions are right a mesocyclone can "spin up" within the supercell giving birth to a tornado. I will cover this later in this post.
But it is the interaction of vertical wind speed shear in the environment with the storm that sets the stage for a cross country trek of several hundred miles.
 |
| Left: A "garden variety" thunderstorm on a typical warm and humid summer afternoon with little wind speed change with height means a vertical updraft. Right: On a day with vertical wind speed shear the updraft tilts. |
In an environment with vertical wind speed shear, right side of the diagram, the updraft tilts and the rain does not fall down through the updraft. The result is a storm with a longer lifetime.
If the shear is too great the storm will not form because the plume that becomes the updraft is sheared apart. This is also an issue meteorologists face when forecasting hurricanes.
The supercell draws in warm, moist air from hundreds of square miles around it. The energy that originally evaporated the water vapor is released back to the storm when it condenses and this conversion helps drive the storm for hours. When the warm, moist inflow is cut off from the the storm it decays.
Tilted updrafts, Echo Free Vaults and More
By the early 1960s tilted updrafts were recognized as an integral part of many thunderstorms, including what was called the SR-Thunderstorm (Severe Right moving - of the average wind) by British Meteorologist Keith Browning. In 1964 he coined the term "supercell" for storms that had the characteristics that we know today as those long-track, long-lived thunderstorms that may produce big tornadoes. We will get back to Browning in a bit.
A Brief Digression: Why right moving of the average wind?
You may run into an explanation for the right moving that says the storm is moving towards the more moist air to the south. In most supercell situations the mean (average) wind direction is from the southwest. To the left (north and northwest) is the drier and cooler air. To the right (south and southeast) is the sticky, moist air from the Gulf of Mexico. However most often supercells are embedded in an expansive, moist air mass with little difference in moisture to the north of the cell.
As supercells age and begin to weaken and the cool pool expands motion may curve towards a more southerly path towards the moist air there but mature supercells follow a nearly straight path which is in a direction right of the mean wind. Look at the image below by Brian Tang of NCAR.
 |
| April 27, 2011. Path of the Supercell that caused the Tuscaloosa, AL tornado. Note the nearly perfect straight line. |
 |
| I eye-balled the mean tropospheric wind direction so it is approximate. |
A similar explanation concerning the Coriolis Effect often surfaces. But a simple coriolis based explanation would have to explain why the path is not a continuous curve to the right. Coriolis does play a part but in a complex interplay with other forces in the very complicated life of a supercell.
So we are left with the two debated dynamic explanations listed below:
So we are left with the two debated dynamic explanations listed below:
- Non-linear Pressure Perturbation Effect (aka vetical wind shear paradigm)
- Linear Pressure Perturbation Effect (aka helicity paradigm)
A complete explanation of the pressure perturbation effects involve some heady mathematics and a fairly deep understanding of atmospheric physics which is beyond the scope of this post. So I will not go into it here.
In addition meteorologists still cannot agree which of the two pressure perturbation effects is more important so I will give a very generalized physical explanation and note that this explanation is incomplete.
Both mechanisms involve importing "tubes" or "helicies" (plural of helix) of environmental rotation and tilting them to the vertical which adds to the updraft rotation as shown below. And both involve increasing the pressure on the left side of the storm (rear flank downdraft or front flank downdraft side and decreasing pressure on the inflow (right side) in very complicated ways. The pressure perturbations happen through different pathways by the two dynamic mechanisms with the same result.
Environmental Rotation
The illustrations and captions explain the concept.
Storm Movement Put SimplyIn addition meteorologists still cannot agree which of the two pressure perturbation effects is more important so I will give a very generalized physical explanation and note that this explanation is incomplete.
Both mechanisms involve importing "tubes" or "helicies" (plural of helix) of environmental rotation and tilting them to the vertical which adds to the updraft rotation as shown below. And both involve increasing the pressure on the left side of the storm (rear flank downdraft or front flank downdraft side and decreasing pressure on the inflow (right side) in very complicated ways. The pressure perturbations happen through different pathways by the two dynamic mechanisms with the same result.
Environmental Rotation
The illustrations and captions explain the concept.
 |
| Left: Wind Speed Shear (change of velocity with altitude) creating horizontal rotation. Note the winds are all blowing in the same direction. Right: Wind Direction Shear (change of wind direction with altitude). The average wind is what ordinary thunderstorms follow. The direction of motion of complex supercells is modified by several mechanisms which raise the pressure on the left side of the storm in the down draft areas and lower the pressure on the right side of the storm in the updraft areas. This makes storm motion to the right of the red arrow in the diagram. |
 |
| Tubes of rotating air can become a helix of rotating air when transported towards the supercell by inflow. They are tilted to the vertical by the updraft and add to the rotation of the updraft. |
 |
| As the helices accelerate into the updraft they are stretched because the strongest updraft is at mid levels in the storm and the rotation rate increases as the helices narrow. Think of an ice skater pulling his or her arms towards the body. As long as this happens and it can for several hours the dynamic mechanisms listed can operate to increase pressure on the left of the storm and decrease pressure on the right of the storm. |
Both dynamic mechanisms and the distribution of rainfall along with the growth and/or decay of the cold pool work together to dictate the fate of a supercell.
Put simply all the factors mentioned and likely others work to lower the pressure in the updraft on the right side of the storm and raise the pressure on the left side of the storm (rear flank downdraft and forward flank downdraft) causing the storm to move to the right of the mean wind. Rising air means lower pressure, sinking air means higher pressure.
Because the storm is steady-state (using energy at the same rate it imports it) and because the updraft is tilted and the rain falls outside the updraft the typical supercell travels in a nearly straight line to the right of the mean wind and can do this for hours until the steady-state balance is upset.
Now Back to Browning and the early 1960s.
Browning stopped his radar from rotating and scanned vertically getting the Range-Height Indicator (RHI) views below. Range means distance from the radar and height is self-explanatory. These radar reflectivity profiles were the start of our modern understanding of supercells.
 |
| Radar reflectivity profiles presented by Keith Browning in 1963 of two thunderstorms with characteristics that we know of today as supercells. Of course it is much more complicated than the simple radar profiles above. Note the large amount of vertical exaggeration about 6.5x. |
The radar images above are from Browning's research and by today's standards very primitive, but then a technological marvel. He was able to see the heavy downpour of the supercell. The front edge of it was called the "wall". The echo free vault , now called the WER (weak echo region) or the BWER (bounded weak echo region) identifies the warm moist inflow and updraft.
You may ask why the updraft looks vertical and not tilted. Remember this is a 2D slice of the storm and the tile occurs in 3D so it is not likely that a given slice will see the tilt/
Using today's technology here is what the BWER of the supercell that spawned the Crittenden-Piner-Fiskburg-Morning View EF4 on March 2, 2012 looked like in plan view (map view ) also called the PPI Display (Plan Position Indicator). The white arrow shows the location of the cross section below.
Each panel shows the PPI display at different antenna tilts from 1.0° to 1.4° to 1.9° above horizontal. The weak echo region is bounded by higher reflectivity.


The cross section runs from SSW to NNE as shown by the white arrow in each map view. The BWER is also called the vault and is located where the inflow of warm, moist air joins the updraft as shown in the image below.

Compare this cross section to the 50-year old images from Browning above and it looks the same. Some of the differences you may see are because each storm is an individual and the vertical exaggeration differs.
Some Additional Information On How Radar Works
Fifty years ago Browning stopped the rotation of his radar and scanned vertically to get the RHI views above. Brownings RHI views are a 2D slice through the supercell.
Modern NEXRAD Doppler radar does a volume scan. It scans the lowest level, approximately 0.5° above horizontal for 360° then tilts to a higher elevation. It does this until the last tilt is 19.6° above horizontal. It starts again at the lowest level.
By interpolating we can get a complete 3D look or a slice look like the image above. The video below explains it. Use reload on your browser if you see an ad.
A Volumetric View
Using the advanced 3D rendering technology in the software GRLevel2 Analyst, you can see a 3D view of the Piner storm. I will have a number of 3D views when we get to tornadoes.
The Big Picture
Supercells are very complex systems and no two thunderstorms looking exactly alike but there are many identifiable characteristics that help the meteorologist diagnose the severity of a storm and what type of severe weather is most likely.
The image below summarizes a typical Classic Supercell.

The photos below are examples of some of the features in the diagram above.
Anvils and Overshooting Tops from The International Space Station
A thunderstorm grows until it bumps its head into the stratosphere at the tropopause. Because the stratosphere is a very stable layer the cloud cannot proceed upwards and it flattens out in a wide layer of clouds called the anvil, named that because in many cases from the ground it looks like a blacksmith's anvil. The higher winds at that level blow the cloud material down wind. The anvil can extend hundreds of miles downwind.
The first two images show the anvil also extending a bit upwind. This is called a back-sheared anvil and happens in many thunderstorms bcause so much air is rising to the tropopause. Notice how there is a distinct edge to the anvils in the photographs. The air that rises violently in the thunderstorm must come back down and in many systems it descends gently all around the thunderstorm creating the distinct edge of the anvil.


The image below shows 5 thunderstorms with merging anvils in 3 of the storms. Notice how clear it is around the storms and note the deep shadows under the anvils.
Anvils from the Ground
From the ground it is easy to see why the thunderstorm anvil was compared to the tool of the blacksmith. The first two are classic anvils and the third from the famous Chaparral Thunderstorm of April 3, 2004 that dropped 2" hail on Chapparral, NM.


Mammatus Clouds - Underside of the Anvil
Cumulonimbus mammatus (most frequently just called mammatus and rarely mammatocumulus) is a cloud form found on the underside of an cumulonimbus anvil. The name is derived from the latin word "mamma" or "udder". They resemble cows's udders.
Mammatus indicate extreme turbulence - rapidly rising and sinking air juxtaposed in a small area. There are a number of mechanisms proposed for the formation of mammatus and the jury is still out. In situations like this there is often more than one mechanism responsible.
Rainshafts
Rainshafts are frequently mistaken for tornadoes and in fact rainshafts can hide tornadoes in some supercells. A tornado hidden by rain is called a "rain wrapped" tornado. More on this topic when we get to tornadoes.


04.08.2013 Work on this post continues.

Compare this cross section to the 50-year old images from Browning above and it looks the same. Some of the differences you may see are because each storm is an individual and the vertical exaggeration differs.
Some Additional Information On How Radar Works
Fifty years ago Browning stopped the rotation of his radar and scanned vertically to get the RHI views above. Brownings RHI views are a 2D slice through the supercell.
Modern NEXRAD Doppler radar does a volume scan. It scans the lowest level, approximately 0.5° above horizontal for 360° then tilts to a higher elevation. It does this until the last tilt is 19.6° above horizontal. It starts again at the lowest level.
By interpolating we can get a complete 3D look or a slice look like the image above. The video below explains it. Use reload on your browser if you see an ad.
A Volumetric View
Using the advanced 3D rendering technology in the software GRLevel2 Analyst, you can see a 3D view of the Piner storm. I will have a number of 3D views when we get to tornadoes.
 |
| Volumetric view of the supercell that caused the EF4 Crittenden-Piner-Fiskburg-Morning View tornado. This is what radar sees and will not look exactly like what you would see from this vantage point. Notice the dome, or overshooting top indicating the top of the updraft. |
 |
| Same view as above with the lower reflectivity levels stripped awav. For the technically minded only reflectivities of 50dBz or greater are shown. This reveals the heavy precipitation core of the storm in red. Note on the ground is the PPI view of radar. See the image below for an annotated view of this image. |
 | ||
| Same image as above with annotations to explain what you see. Notice how the inflow rises into the BWER. |
The Big Picture
Supercells are very complex systems and no two thunderstorms looking exactly alike but there are many identifiable characteristics that help the meteorologist diagnose the severity of a storm and what type of severe weather is most likely.
The image below summarizes a typical Classic Supercell.

The photos below are examples of some of the features in the diagram above.
Anvils and Overshooting Tops from The International Space Station
A thunderstorm grows until it bumps its head into the stratosphere at the tropopause. Because the stratosphere is a very stable layer the cloud cannot proceed upwards and it flattens out in a wide layer of clouds called the anvil, named that because in many cases from the ground it looks like a blacksmith's anvil. The higher winds at that level blow the cloud material down wind. The anvil can extend hundreds of miles downwind.
 |
| Blacksmith's Anvils. Courtesy: www.theblacksmithsanvil.com |
The first two images show the anvil also extending a bit upwind. This is called a back-sheared anvil and happens in many thunderstorms bcause so much air is rising to the tropopause. Notice how there is a distinct edge to the anvils in the photographs. The air that rises violently in the thunderstorm must come back down and in many systems it descends gently all around the thunderstorm creating the distinct edge of the anvil.


The image below shows 5 thunderstorms with merging anvils in 3 of the storms. Notice how clear it is around the storms and note the deep shadows under the anvils.
 |
| All three images courtesy NASA, from the International Space Station. |
Anvils from the Ground
From the ground it is easy to see why the thunderstorm anvil was compared to the tool of the blacksmith. The first two are classic anvils and the third from the famous Chaparral Thunderstorm of April 3, 2004 that dropped 2" hail on Chapparral, NM.


 |
| The three images above coutesy, NOAA. |
 |
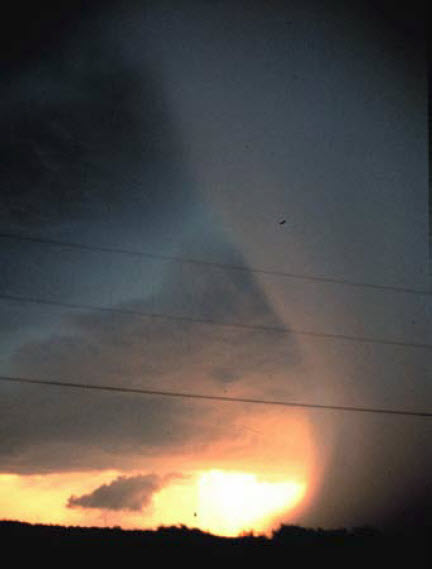
| A developing thunderstorm off the coast of Texas near Houston. Note the developing anvil and the location of the updraft as indicated by the overshooting top. Also note the falling rain about 1/3 of the way up on the right. It is evaporating long before it hits the surface of the Gulf of Mexico. The rain is falling outside of the tilted updraft. This storm is pre-supercell and may or may not have developed that far. Thye annotated image is below. Photograph by Steve Horstmeyer. |

Mammatus Clouds - Underside of the Anvil
Cumulonimbus mammatus (most frequently just called mammatus and rarely mammatocumulus) is a cloud form found on the underside of an cumulonimbus anvil. The name is derived from the latin word "mamma" or "udder". They resemble cows's udders.
Mammatus indicate extreme turbulence - rapidly rising and sinking air juxtaposed in a small area. There are a number of mechanisms proposed for the formation of mammatus and the jury is still out. In situations like this there is often more than one mechanism responsible.
 |
| Courtesy, NOAA |
Rainshafts are frequently mistaken for tornadoes and in fact rainshafts can hide tornadoes in some supercells. A tornado hidden by rain is called a "rain wrapped" tornado. More on this topic when we get to tornadoes.
 |
| Top: an Oklahoma rainshaft with torrential rain. Below: A Doppler on Wheels looks at a rainshaft in the distance. Both photographs courtesy, NOAA. |
Shelf Clouds

 |
| Orange arrow - warm moist air flowing into the thunderstorm, above and lifted by the denser rain cooled air flowing out of the thunderstorm. Dark blue arrows- warm air mixes with the cool air below, condenses and falls through the cool air. Light blue arrow - the cool outflow from the thunderstorm. Hebron, KY, June 15, 2012 by Stephanie West from the Kroeger store near CVG. |
 |
| Same shelf cloud as above from below as it arrives traveling to the right. |
 |
| Same shelf cloud as in photos above but looking at it from the front near CVG. Image below is enhanced for easier recognition. |
 |
| An enhanced view of the shelf cloud from near CVG in the photos above. The shelf cloud has been lightened in for illustration purposes. This is t he same shelf cloud as the two images above but from the front as it approaches. |
 |
| A High Plains LP supercell shelf cloud. More on LP and other types of supercells below. |
Supercells - Classic, LP and HP
Supercells and all thunderstorms are cumulonimbus clouds. In meteorological shorthand written "Cb". Supercells come in three flavors, Classic, LP (light or low precipitation) and HP (heavy or high precipitation).
The difference between them is essentially due to the amount of low and middle level moisture in the atmosphere and that is most often a function of geography.
Low Precipitation Supercells are found in the high Great Plains to the east of the Rocky Mountains where moisture is often scant resulting in less cloud volume than Classic or HP Supercells.. With a fairly dry atmosphere visibility is unrestricted and cloud development associated with and around the supercell is minimal resulting is a dramatic looking skyscapes. The photograph above is one example.
The photo below is a remarkable example of a LP Supercell. Supercells like this are sometimes called "barber pole" LP Supercells. Because cloud development around the rotating updraft is limited in LP Supercells the outer edges of the rotating updraft can often be seen as clouds moving in an upward spiral.
 | |
|
I have annotated the image below the original showing features typical of LP Supercells

For more photographs by this remarkable photographer on a variety of topics check out the link:
The small shelf cloud is due to the fairly dry atmosphere which leads to less condensation and less cloud volume than in a more moist atmosphere. Rain falls outside the cloud because of smaller cloud volume. In a Classic or HP Supercell the rain would be hidden within the cloud until it emerges below cloud base.
LP Supercell Characteristics:
- Strong updraft because of low precipitation loading.
- Large hail because of strong updraft.
- High cloud base because of low moisture content of atmosphere.
- Strong straight-line winds because of strong evaporative cooling.
- Fewer and weaker tornadoes than other types of supercells because of high cloud base, weak or absent rear flank downdraft and forward flank downdraft because of less precipitation.
- Highly visible tornadoes because of low moisture content of atmosphere.


