Interesting Weather Information

Tuesday, July 12, 2022

Outflow Boundaries and The 6 June 2022 Goshen, Ohio Tornado


The Tornadoes of 6 July 2022 near Cincinnati, OH, USA

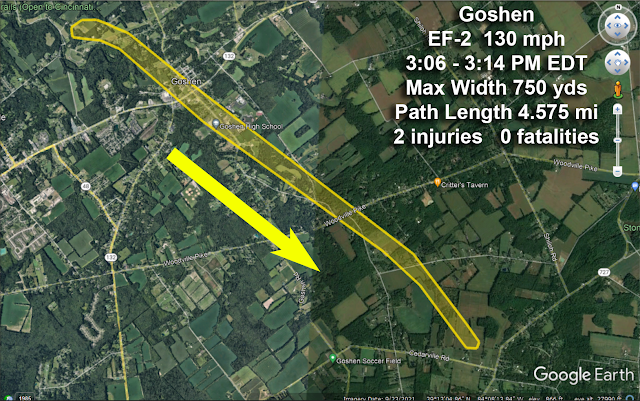
Around 3PM EDT 6 July 2022 three tornadoes touched down east of Cincinnati, two in Clermont County and one just east in Brown County. The maps below show the locations.  


What Meteorologists Look for When Tracking Tornadoes on Radar

The video below, with an audio narration, shows the movement of the severe thunderstorms and outflow boundaries resulting in the three tornadoes. Tools I used: RadarScope, a professional level radar analysis tool, GR2 Analyst for the Normalized Rotation (NROT) data, Google Earth Pro, Photoshop and Camtasia Studio.

In the video I show the interaction of an Outflow Boundary (OFB) and the severe thunderstorm as it approaches.  You will see how there is a sudden increase of strength as the storm interacts with the outflow boundary.


Conclusions:  
  • The storm interacted with the outflow boundary and strengthened it just east of Goshen.
  • The OFB did not "cause" the tornado, because the storm was rotating before it interacted with the OFB.
  • The storm did not ride up and over the OFB the the rain cooled pool of air behind it as many storms do (videos below).
  • Most likely the OFB acted to increase surface convergence ahead of the updraft core, strengthening the updraft enough to increase the rotation through vertical stretching see video below). 
Stretching an Updraft and Increasing Rotation


A Typical Thunderstorm - No Audio


The next video, from my YouTube library, shows a schematic of a typical thunderstorm.  

To be sure, "typical" does not mean all thunderstorms look exactly alike. You can pause the video and look at the diagram in more detail if you want to get a better feel for what's going on in and around a thunderstorm.

You can pause the video for a closer look. Be sure to look at the "Forward Flank Downdraft" or "Gust Front" another name for an "Outflow Boundary" (OFB).


The video below (this one has audio) shows how the pool of rain cooled air can increase lift, or upward motion, in a thunderstorm. In the Goshen tornado this may have played a part as the inflowing air wrapped around the rotation core and flowed into and upward through the storm.

It is more likely in this case that an "low level inflow jet" flowed parallel to the OFB and was "squeezed" (another way of saying surface convergence was increased) as it flowed into the storm and intensified the updraft.

I do not have enough radar evidence to be conclusive about this however.


Other Video Examples of  Outflow Boundaries and Their Effects for You

 All videos are silent.


Thursday, February 17, 2022

"Rogue" Thunderstorm 02.17.2022 Near Cincinnati, Ohio

We were watching the thunderstorm grow then scream to the northeast over Madison, IN and were amazed at the torrential rain, indications of hail on radar, and worried that it may mean a severe thunderstorm warning for Cincinnati metro. GR2Analyst indicated an extreme tilt, and Normalized Rotation (NROT) was zero. 

In addition there was a small core of  turbulence (spectrum width) which looked like a hail core. Echo tops were low, only about 20k feet and only a small amount of lightning was indicated. 

In addition the cell's position just northeast of the surface low convinced me that the storm, which was behind the surface position of the cold front, formed on the frontal surface aloft and being elevated convection was not likely to pose a damaging wind threat.

The NWS in Wilmington tweeted that it was a "rogue storm" which fits because it is the only lightning producer in the Cincinnati area all day despite our expectations of more.


@NWSILN Tweet

Rogue Storm passes over Madison, IN heading to Cincinnati

Close up of Rogue Storm


HRRR MODEL OUTPUT -  850mb Jet east of arrows - animated gif

ABOVE:
HRRR 18z Run 02.17.2022 (from pivotalweather.com)
First panel 18z Initial
55kt - 65kt 850mb jet over West Central KY
Temp at 850mb 9°C to 10°C
Temp Advection 5°C / hr on the nose of jet
Circle = 850 frontogenesis - circle is 2°C / 100km / 3hrs

Second Panel 21z Forecast
50kt to 80kt 850 jet  - nose south of Cincinnati
Temp 9°C to 10°C Madison IN
Temp Advection 3°C to 4°C same area nose of jet
Circles = Frontogenesis has doubled around Cincinnati


SURFACE MAP 21Z 02.17.2022 using Digital Atmosphere