Introduction
What I like best about being a TV meteorologist is that you never know when out of the blue something really cool ends up in your in box and you get to talk or write about it.
This is another one of those moments.
This post is divided into two parts: A discussion of wave clouds and this particular occurrence for the general public which is followed by a more technical discussion of this situation for the meteorologist.
Wave Clouds Feb 24, 2014 photographed by Kathleen Niece in Warsaw, KY.
The photos below were taken a Kathleen Niece, a talented photographer and frequent contributor of great images for
Picture the Weather on WXIX-TV, locally known as FOX19.
 |
Wave clouds over Warsaw, KY Feb. 24, 2014 at 4:40 PM EST (2140z).
Photographer: Kathleen Niece.
|
 |
Wave clouds over Warsaw, KY Feb. 24, 2014 at 4:40 PM EST (2140z).
Photographer: Kathleen Niece.
|
 |
Wave clouds over Warsaw, KY Feb. 24, 2014 at 4:40 PM EST (2140z).
Photographer: Kathleen Niece.
|
These are called
wave clouds and are caused by
gravity waves. On any given day you can see them on satellite pictures around the world.
Satellite Views of This Wave Cloud Occurrence
 |
| GOES East 2145z (4:45 PM EST) visible image the highlighted circle is the area of interest. This is 5 minutes after Kathleen Niece photographed the wave clouds. The resolution along with jpg compression artifacts make this image useless as a source of information on the wave clouds. |
The GOES (Geostationary Operational Environmental Satellite) image above is taken from approximately 22,236 miles above the equator. The orbit of the satellite matches Earth's rotation so the satellite appears stationary. This is called a geosynchronous orbit.
The information here lacks enough resolution to see the wave clouds.
As luck would have it this time polar orbiting satellite NOAA 15 passed over the Cincinnati metro area and the area of the wave clouds a
t 22:30z (5:30 PM EST) about 50 minutes after Kathleen Niece's photographs.
Polar orbiting satellites orbit at an altitude between 515 and 540 miles (830 to 870 miles in a sun synchronous orbit over the poles. As they move north and south Earth rotates and the data looks like the strip below taken late afternoon (22:30:15 to 22:30:56 or 5:30:15 PM EST to 5:30:56 PM EST) on February 24, 2014. Larger images are stitched together from the strips.
The NOAA 15 images were processed with HRPT Reader by David J. Taylor of Edinburgh, Scotland. The software is available online at
http://www.satsignal.eu/software/hrpt.htm
 |
| NOAA 15 Polar-orbiting satellite image from 22:30z (5:30PM EST) February 24, 2014. Click image for a larger view. |
 |
| Close up view of the NOAA 15 false color image above. Warsaw, KY is on the Ohio River in the center of the circle. Note the stripes of cloud cover north of the circle. |
 |
| A tighter view of the NOAA 15 image with the circle removed. This has been contrast enhanced and selectively smoothed in Photoshop. The dots are transmission noise and the wave clouds are clearly visible southwest of "Cin" which is Cincinnati, Ohio, USA. |
 |
| Same as above but a very tight enlargement. |
Waves and Wave Clouds From Around the World
 |
| Wave clouds downwind of the Appalachian Mountains, NOAA. |
 |
| Wave clouds downwind of the South Sandwich Islands, South Atlantic Ocean. Courtesy: NASA |
 |
Tropical Cyclone Mahasen moving north the in the Indian Ocean on
May 13, 2013 as seen by the the Suomi NPP satellite. Note the gravity
waves with out clouds but visible because of air glow, moving outwards from
the center of the tropical cyclone. Courtesy: NASA
|
From the ground they look like Kathleen's photos above or the following:
 |
Wave clouds in a dry atmosphere over southern Algeria.
Photographer: Pir6mon from Wikipedia.
|
 |
Waves in altostratus. Courtesy: NOAA Photo Library
|
 |
Wave clouds over Burra, Australia.
Photographer: David McIlroy from Wikipedia.
|
 |
Noctilucent (night shining) wave clouds over Follestaddalen, Orsta, Norway,
2:00 a.m. July 27, 2008. Noctilucent clouds form in very cold air at altitudes
around 50 miles and are thought to be composed of ice coated meteoric dust.
Photographer: Geir T. Øye from Earth Science Picture of the Day.
|
 |
Waves in cirrocumulus March 11, 2014, 3 PM EDT (19z), Cincinnati, OH, USA.
Photographer: Steve Horstmeyer
|
 |
Waves in altostratus, March 11, 2014 3 PM EDT (19z), Cincinnati, OH, USA.
Photographer: Steve Horstmeyer
|
The waves that generate wave clouds are called gravity waves and named for the force that tries to restore the displaced air to its original position.
In the concentric waves that radiate outward from the pebble tossed in the pond, gravity pulls the displaced water back towards the pre-disturbed position. But the water overshoots the original position and as the energy radiates outward as the wave oscillates above and below the middle or equilibrium position.
Waves on the surface of water are called surface gravity waves to distinguish them from internal gravity waves. The waves that cause parallel lines of cloud rolls are within the atmosphere and the restoring force is gravity. Therefore they are called internal gravity waves. Technically the waves on the surface of water could also be called internal if you consider the atmosphere and water making up a single two-fluid system.
There are many other names that can be applied for specific circumstances, for example waves on the surface of the ocean are surface gravity waves but they are often called wind waves or just water waves.
Waves like this occur frequently in the atmosphere and they are not always visible especially in dry air. In fact clear air turbulence, the bane of uneasy air travelers, often rattles aircraft with no visible warning.
I have borrowed the best diagram I have ever seen that illustrates wave clouds from this very nice website:
Here is that illustration:

This diagram specifically refers to wave clouds over open water but could apply to air flow downwind of a mountain range or any of the wave clouds pictured above.
As the air flows upwards into a crest of a wave it cools. When it cools so that the relative humidity has reached 100% clouds form in the crest.
As the air sinks into the trough of the wave it is compressed and warms, the relative humidity drops and the clouds evaporate. This continues through the entire wave system.
Meteorological Analysis: February 24, 2014
The following is a technical discussion aimed at meteorologists and students of meteorology that discusses the cause of the wave clouds photographed by Kathleen Niece from Warsaw, KY, USA (Latitude 38.78, Longitude -84.90) shown above.
Surface Map 20z 24Feb2014
 |
Surface analysis Feb. 24, 2014 at 20z (3PM EST USA). The ridge of high pressure extending from the Gulf of Mexico into western Canada is an arctic air mass. The dense cold air hugs the surface, the top boundary of the anticyclone is the altitude where the wave clouds occurred.
|
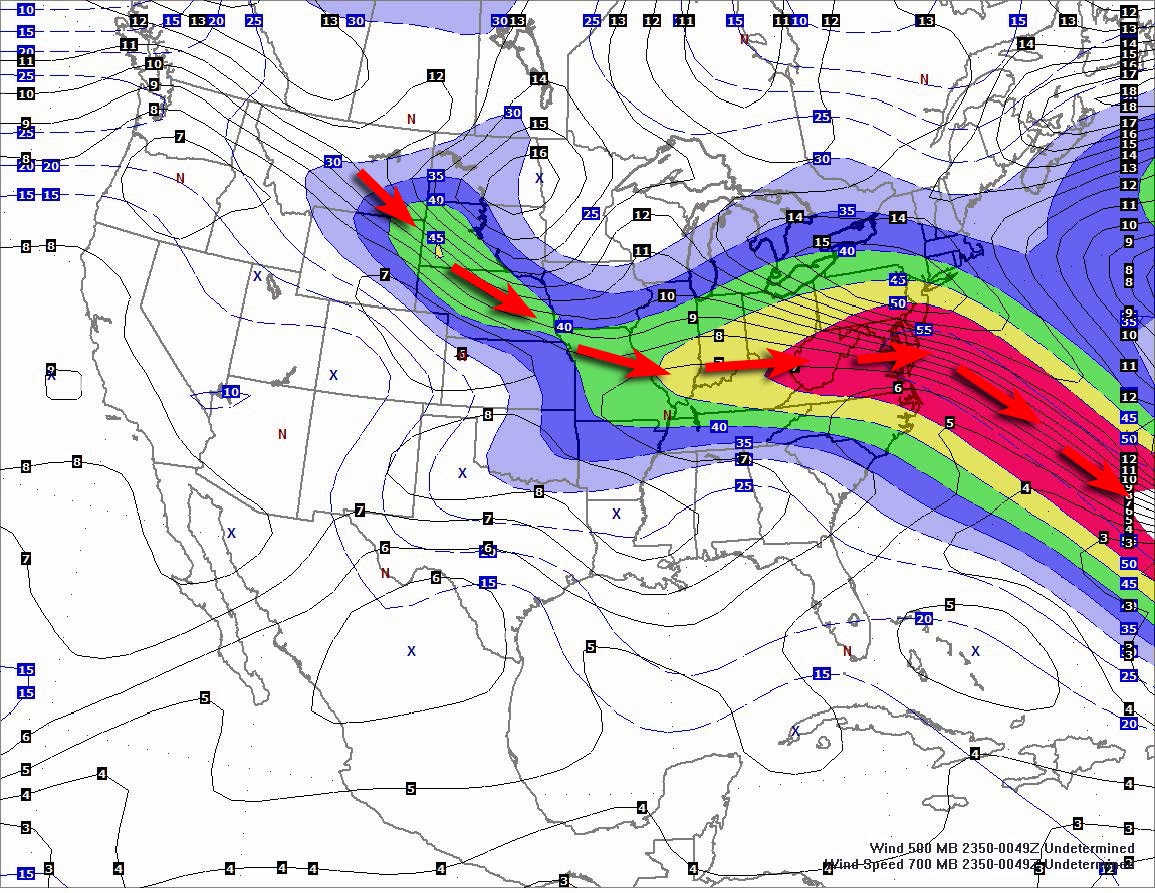
700 hPa Chart 00z 25Feb2014, Height (solid) and Wind Speed in knots (dashed).
 |
| At 700 hPa the axis of maximum wind speed is shown with the red arrows. |
700 hPa Wind Speed and 500 hPa Absolute Vorticity 00z 25Feb2014
850 hPa Streamlines 00z 25Feb2014
 |
| Confluence of the 700 hPa winds from eastern Iowa and Missouri over central and southern Illinois, western Kentucky and southern Indiana. The confluent pattern indicates a jet flowing across the top of the cold air mass. take a look at the sounding below. |
Wilmington, Ohio (KILN) Sounding 00z 25Feb2014
 |
| Skew-T/log P Diagram 00z 25Feb2014 KILN, Wilmington, OH. Plotted with RAOB. |
 |
| Skew-T/log P Diagram 00z 25Feb2014 KILN, Wilmington, OH, same as above, plotted with RAOB with inversion and frontal analysis. |
 |
| Atmospheric cross section , 00z 25Feb2014 west to east from Denver (KDNR) to Pittsburgh ( KPIT)KILN. Plotted and analyzed with RAOB. Colored background = potential temperature (isentropes) showing surface arctic air mass in blue. Dashed line is the zone of vertical wind shear immediately above the arctic air. |
 |
| Atmospheric cross section , 00z 25Feb2014 north to south from Alpena, MI (KAPX) to Birmingham, AL (KBMX). Plotted and analyzed with RAOB. Colored background = potential temperature (isentropes) showing surface arctic air mass in blue. "X" indicates a center of maximum wind shear. |
 |
| Atmospheric cross section , 00z 25Feb2014 north to south from International Falls, MN (KINL) to Little Rock, AR (KLZK) Plotted and analyzed with RAOB. Colored background = potential temperature (isentropes) showing surface arctic air mass in blue. "X" indicates a center of maximum wind shear. |